Geotab Data Connector Template Guide
Support Document
0 mins to read
Templates provided for the Geotab Data Connector can be downloaded either from the User Guide, or directly from the Data Connector add-in page. Templates were designed to provide an out of the box insight ready solution demonstrating how the Data Connector can be used to answer key questions about your fleet. Keep in mind that once the templates are downloaded, you are free to customize your dashboard however you see fit to best suit your insight needs.
Template Guide and Library
EN - CS-CZ - DE-DE - ES-ES - ES-LATAM - FR-CA - FR-FR - IT-IT - JA-JP - KO-KR - NL-NL - PL-PL - PT-BR - SV-SE
February 2025
Introduction
The Geotab Data Connector is a tool designed for fleet managers to import curated data sourced from their own fleets into their preferred BI/visualization tool without having to manually leverage MyGeotab reports. Additionally, this tool allows fleet managers to customize their reports without the need for coding, unlike the MyGeotab SDK.
This document provides instructions on how to initially download and access the templates, along with an overview of the information available within them.
Template Gallery
The templates can now be found on the main Data Connector page under Reports. Each template is available for PowerBI, Tableau and Excel in both metric and imperial units.

Getting Started
Power BI template
Follow the steps below to get started, or follow this video.
- Open the Power BI template directly.
✱ NOTE: When opening the template for the first time, all sheets will be blank with some connection errors as the user credentials have not yet been entered.
- Click Refresh.

- Enter login credentials (if you have accessed GDC through Power BI previously, your credentials may already be saved locally):
User name: <MyGeotab Database Name>/<MyGeotab Username>- Example: Database123/johnsmith@geotab.com
Password: <My Geotab Password>- Level to apply settings: https://data-connector.geotab.com/

- Click Connect.

- If you need to edit the credentials at a later time, you can do so by clicking File > Options and then Settings > Data source settings to edit the permissions for each table.
Tableau template
- Open the Tableau template directly.
✱ NOTE: When opening the template for the first time, all sheets will be blank with some connection errors as the user credentials have not yet been entered.
- Find your base access URL from MyGeotab > Administration > Geotab Data Connector. For more info about access URL, refer to the Geotab Data Connector User Guide.
If your base access URL is https://odata-connector-1.geotab.com/odata/v4/svc/, do the following:
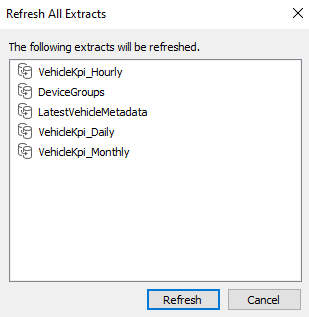
- Click Refresh All Extracts.

- Click Refresh in the window that appears.
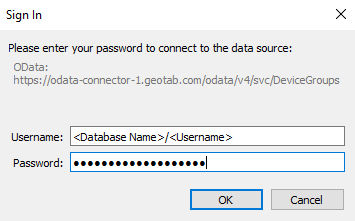
- Tableau will prompt you to enter credentials for all four source tables. Enter your MyGeotab credentials as the windows pop up:
Username: <MyGeotab Database Name>/<MyGeotab Username>- Database123/johnsmith@geotab.com
Password: <MyGeotab Password>
- After credentials are entered for each source table, your data will load into the template.
If you have a different base access URL, do the following:
- Under Data, navigate to the first data source and select Edit Data Source.

- Update the Server to match your Access URL, making sure to keep the table identifier at the end of the URL. Enter your MyGeotab credentials and click Sign In.

- After the connection summary loads, navigate to any of the dashboard tabs at the bottom of the screen.

- Repeat steps 1-3 for the four remaining data sources.
- Click Refresh All Extracts.
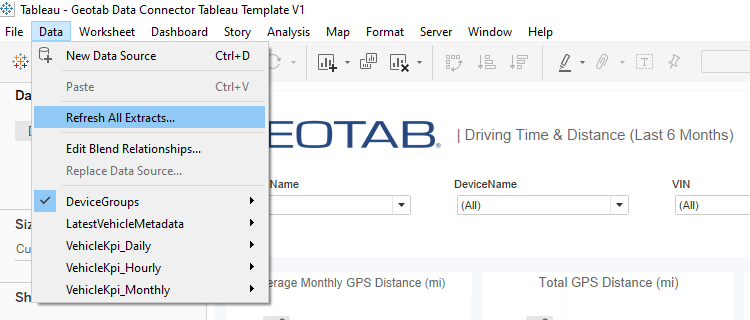
- Click Refresh in the window that appears.

Excel template
- Open the Excel template.
✱ NOTE: When opening the template for the first time, all sheets will be blank with some connection errors as the user credentials have not yet been entered.
- Under the Data menu, click Refresh All.

- Enter your credentials (if you have accessed GDC through Power BI previously, your credentials may already be saved locally):
User name: <MyGeotab Database Name>/<MyGeotab Username>- Database123/johnsmith@geotab.com
Password: <MyGeotab Password>- Level to apply settings: https://data-connector.geotab.com/

- Click Connect.

- If you need to edit the credentials at a later time, you can do so by clicking Data > Get Data > Data source settings to edit the permissions for each table.
Vehicle KPI Template Overview
Templates are designed to provide an out-of-the-box insight-ready solution demonstrating how the Data Connector can be used to answer key questions about your fleet. Once the templates are downloaded, you are free to customize your dashboard to best suit your insight needs.
✱ NOTE: Templates for insight-ready data visualizations are currently available for Power BI and Tableau. The Excel template only provides sample data for design and testing purposes.
Distance & Time
Monthly aggregated metrics focusing on GPS distance and driving time for the last 6 completed months, including:
- How has my fleet’s driving distance and driving time trended over the last 6 completed months?
- What is my fleet’s average monthly driving distance?
- What is my fleet’s average monthly driving time?
- Which vehicle drove the longest distance or time last month?
- Which vehicle drove the shortest distance or time last month?
- How did last month’s driving time and distance compare to the previous month?

Metric
Calculation
Average Monthly GPS Distance (mi)
Sum of VehicleKpi_Monthly[GPS_Distance_km] multiplied by 0.621371 to convert km to mi, divided by total number of months
Total GPS Distance (mi)
Sum of VehicleKpi_Monthly[GPS_Distance_km] multiplied by 0.621371 to convert km to mi
GPS Distance Last Month (mi)
Sum of VehicleKpi_Monthly[GPS_Distance_km] multiplied by 0.621371 to convert km to mi and filtered to only include the last completed month
Average Monthly Time (hrs)
Sum of VehicleKpi_Monthly[DriveDuration_Seconds] divided by 3600 to convert seconds to hours, divided by total number of months
Total Time (hrs)
Sum of VehicleKpi_Monthly[DriveDuration_Seconds] divided by 3600 to convert seconds to hours
Time Last Month (hrs)
Sum of VehicleKpi_Monthly[DriveDuration_Seconds] divided by 3600 to convert seconds to hours and filtered to only include the last completed month
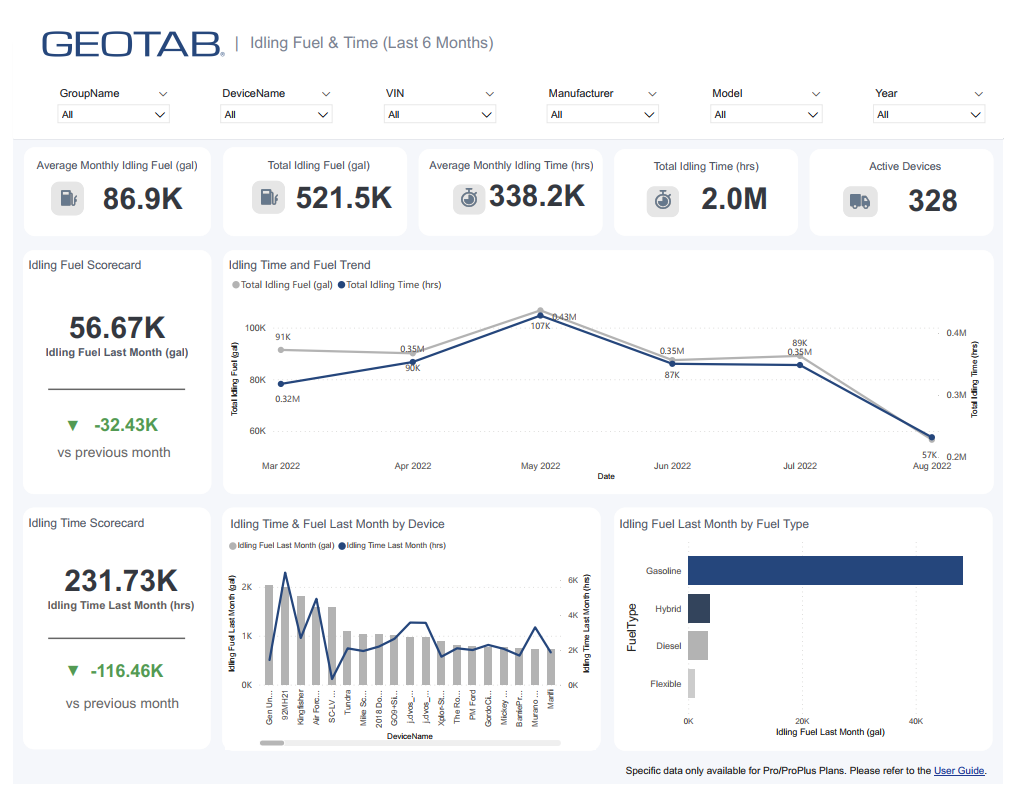
Idling
Monthly aggregated metrics focusing on idling time and idling fuel usage for the last 6 completed months, including:
- How has my fleet’s idling fuel usage and idling time trended over the last 6 completed months?
- What is my fleet’s average monthly idling fuel usage?
- What is my fleet’s average monthly idling time?
- Which vehicle had the largest idling fuel usage or longest idling time last month?
- Which vehicle had the smallest idling fuel usage or shortest idling time last month?
- How did last month’s idling fuel usage and idling time compare to the previous month?
Metric
Calculation
Average Monthly Idling Fuel (gal)
Sum of VehicleKpi_Monthly[IdleFuel_Litres] multiplied by 0.264172 to convert litres to gallons divided by total number of months
Total Idling Fuel (gal)
Sum of VehicleKpi_Monthly[IdleFuel_Litres] multiplied by 0.264172 to convert litres to gallons
Idling Fuel Last Month (gal)
Sum of VehicleKpi_Monthly[IdleFuel_Litres] multiplied by 0.264172 to convert litres to gallons and filtered to only include the last completed month
Average Monthly Idling Time (hrs)
Sum of VehicleKpi_Monthly[IdleDuration_Seconds] divided by 3600 to convert seconds to hours divided by total number of months
Total Idling Time (hrs)
Sum of VehicleKpi_Monthly[IdleDuration_Seconds] divided by 3600 to convert seconds to hours
Idling Time Last Month (hrs)
Sum of VehicleKpi_Monthly[IdleDuration_Seconds] divided by 3600 to convert seconds to hours and filtered to only include the last completed month
Fuel Economy
Monthly aggregated metrics focusing on fuel economy for the last 6 completed months. It is important to note that the fuel distance may be different from GPS distance because fuel distance is only recorded when the device has also recorded fuel consumption. This ensures that fuel economy calculations are accurate in the case where fuel usage is not reported for certain vehicles or trip segments, and is reasonable to assume is representative of total performance in the vast majority of cases.
- How has my fleet’s fuel economy trended over the last 6 completed months?
- How has my fleet’s fuel usage and fuel distance trended over the last 6 completed months?
- What is my fleet’s average fuel economy?
- What is my fleet’s average fuel economy by fuel type?
- How did last month’s fuel economy compare to the previous month?
- How did last month’s fuel usage compare to the previous month?

Metric
Calculation
Total Fuel Distance (mi)
Sum of VehicleKpi_Monthly[FuelEconomy_Distance_Km] multiplied by 0.621371 to convert km to mi
Total Fuel (gal)
Sum of VehicleKpi_Monthly[TotalFuel_Litres] multiplied by 0.264172 to convert litres to gallons
Total Fuel Economy (mpg)
Sum of VehicleKpi_Monthly[FuelEconomy_Distance_Km] divided by Sum of VehicleKpi_monthly[TotalFuel_Litres] multiplied by 2.35215 to convert km/L to mpg
Fuel Economy Last Month (mpg)
Sum of VehicleKpi_Monthly[FuelEconomy_Distance_Km] divided by Sum of VehicleKpi_monthly[TotalFuel_Litres] multiplied by 2.35215 to convert km/L to mpg and filtered to only include the last completed month
Fuel Usage Last Month (gal)
Sum of VehicleKpi_Monthly[TotalFuel_Litres] multiplied by 0.264172 to convert litres to gallons and filtered to only include the last completed month
Utilization
Monthly aggregated metrics focusing on utilization for the last 6 completed months. Two methods of calculating utilization are demonstrated on this tab.
- How has my vehicle utilization trended over the last 6 completed months?
- How has my fleet utilization trended over the last 6 completed months?
- How did last month’s vehicle utilization compare to the previous month?
- How did last month’s fleet utilization compare to the previous month?

Metric | Calculation |
Vehicle Utilization | Sum of VehicleKpi_Monthly[TotalEngine_Hours] divided by distinct count of vehicles in fleet multiplied by total time period in hours |
Vehicle Utilization Last Month | Sum of VehicleKpi_Monthly[TotalEngine_Hours] divided by distinct count of vehicles in fleet multiplied by total time period in hours and filtered to only include the last completed month |
Fleet Utilization | Distinct count of vehicles in fleet with VehicleKpi_Monthly[GPS_Distance_Km] > 0 divided by distinct count of vehicles in fleet |
Fleet Utilization Last Month | Distinct count of vehicles in fleet with VehicleKpi_Monthly[GPS_Distance_Km] > 0 divided by distinct count of vehicles in fleet and filtered to only include the last completed month |
Daily Analysis
Daily aggregated metrics displaying the main metrics from the first four monthly aggregated tabs as a daily trend for the last 30 days. It includes a map visual plotting each vehicle’s last known location coordinates for each day.
- How have my fleet’s key metrics trended by day over the last 30 days?
- Where is the last recorded daily location of each of my vehicles?

Metric | Calculation |
Driving Time (hrs) | Sum of VehicleKpi_Daily[DriveDuration_Seconds] divided by 3600 to convert seconds to hours |
Driving Distance (mi) | Sum of VehicleKpi_Daily[GPS_Distance_Km] multiplied by 0.621371 to convert km to miles |
Idling Time (hrs) | Sum of VehicleKpi_Daily[IdleDuration_Seconds] divided by 3600 to convert seconds to hours |
Idling Fuel (gal) | Sum of VehicleKpi_Daily[IdleFuel_Litres] multiplied by 0.264172 to convert litres to gallons |
Fuel Economy (mpg) | Sum of VehicleKpi_Daily[FuelEconomy_Distance_Km] divided by Sum of VehicleKpi_Daily[TotalFuel_Litres] multiplied by 2.35215 to convert km/L to mpg |
Fuel Usage (gal) | Sum of VehicleKpi_Daily[TotalFuel_Litres] multiplied by 0.264172 to convert litres to gallons |
Vehicle Utilization | Sum of VehicleKpi_Daily[TotalEngine_Hours] divided by distinct count of vehicles in fleet multiplied by total time period in hours |
Fleet Utilization | Distinct count of vehicles in fleet with VehicleKpi_Daily[GPS_Distance_Km] > 0 divided by distinct count of vehicles in fleet |
Safety Benchmark Template Overview
The Safety Benchmark template is designed to provide a high-level overview of the fleet’s overall safety performance and comparison to benchmark and peer group leaders. The template is followed by some interactive visuals to show the areas where vehicles are performing better or worse than the benchmarks.
The quadrant chart is designed to help you identify the individual drivers that need the most attention. For example, the top-right quadrant includes the cases that have a higher collision rate than the predicted benchmark. The top-left quadrant includes cases that have a lower collision rate than the predicted benchmark.
The template also provides a relative comparison of the different groups based on their average predicted collision rate, as well as a detailed overview of the performance at the vehicle level.
Exception Events Template Overview
Vehicle Exception Events
The Vehicle Exception Events template helps fleet managers track rule violations by asset. Use it to identify which rules are triggered most often, which vehicles are accumulating the most exceptions, and how exception activity trends day over day.
The template includes filters for Group, Asset, VIN, Rule, and Rule ID, and supports Daily, Weekly, and Monthly views.
- Which exception rules are triggered most often across the fleet?
- Which vehicles have the highest exception event counts or longest durations?
- How many unique rules and assets are generating exceptions?
- Which exception category (Safety, Compliance, Productivity, etc.) drives the most activity?
- How is exception activity trending over time relative to distance driven?

Metric | Calculation |
Exception Events | SUM(DeviceExceptionEvent_Daily[Event_Count]) |
Rules with Exceptions | DISTINCTCOUNT(DeviceExceptionEvent_Daily[RuleId]) |
Assets with Exceptions | DISTINCTCOUNT(DeviceExceptionEvent_Daily[DeviceId]) |
Avg Exception Duration (min) | DIVIDE(SUM(DeviceExceptionEvent_Daily[Duration_Seconds]), COUNTROWS(DeviceExceptionEvent_Daily)) / 60 |
Avg Exception Distance (km) | DIVIDE(SUM(DeviceExceptionEvent_Daily[Distance_Km]), COUNTROWS(DeviceExceptionEvent_Daily)) |
Driver Exception Events
The Driver Exception Events template helps fleet managers track rule violations by driver. Use it to identify which drivers are generating the most exceptions, compare exception rates across your workforce, and monitor trends over time.
The template includes filters for Group, Driver, Rule, and Rule ID, and supports Daily, Weekly, and Monthly views.
- Which exception rules are triggered most often at the driver level?
- Which drivers have the highest exception event counts or longest durations?
- How many unique rules and drivers are generating exceptions?
- Which exception category (Safety, Compliance, Productivity, etc.) drives the most activity?
- How does exception activity compare across drivers within a group?
Metric | Calculation |
Exception Events | SUM(DriverExceptionEvent_Daily[Event_Count]) |
Rules with Exceptions | DISTINCTCOUNT(DriverExceptionEvent_Daily[RuleId]) |
Drivers with Exceptions | DISTINCTCOUNT(DriverExceptionEvent_Daily[DriverId]) |
Avg Exception Duration (min) | DIVIDE(SUM(DriverExceptionEvent_Daily[Duration_Seconds]), COUNTROWS(DriverExceptionEvent_Daily)) / 60 |
Avg Exception Distance (km) | DIVIDE(SUM(DriverExceptionEvent_Daily[Distance_Km]), COUNTROWS(DriverExceptionEvent_Daily)) |
