Support Document
0 mins to read
Green Fleet Dashboard in MyGeotab
Support Document
0 mins to read
Learn more about the Green Fleet Dashboard, a free Marketplace Add-in that provides fleet managers with an easy tool to monitor fuel economy and reduce emissions. The dashboard provides weekly and monthly metrics on fuel use, emissions and driver behaviour, insight into the fleet’s environmental performance, and flags opportunities for improvement.
User Guide
Last Updated:
Green Fleet Dashboard Overview
The Green Fleet Dashboard is a free Marketplace Add-In that provides fleet managers with an easy tool to monitor their efforts in improving fuel economy and reducing emissions. The dashboard provides metrics on fuel use, emissions, Electric Vehicle (EV) usage and driver behavior, providing insight into the fleet’s cost and environmental performance over time, and identifying opportunities for improvement.
✱ NOTE: Fuel related data provided in the Green Fleet Dashboard is estimated and is not intended for use in official reporting. Fuel related data includes fuel consumption, fuel costs, and emissions. Geotab is committed to continually improving support for fuel data.
Dashboard Settings
The dashboard is configured from the Options menu, accessible by hitting the Options button. The settings available in the Options menu determine the values that display on the dashboard and are configured based on dates and vehicle types of interest.
Chart values on the dashboard display as either averages, totals or default (Geotab’s best recommendations) depending on the Chart settings selection. To set the values to display the average per distance unit (e.g. 0.4 Harsh Cornering exceptions / 100 km), select Average. To display the totals, select Total. To display our best recommendation, select Default.
The Powertrain Types and Vehicle Types selections are configured to show data from subsets of the fleet as needed. These also adjust the Benchmark and Best-in-class values.
We calculate fuel and energy costs rates daily. To use our daily rate calculations, select Use our source. If you want to input a custom rate, select Custom and input your rate in the space provided. The units for costs, energy, and volumes can be adjusted in your MyGeotab user settings. To save the selections made and update the dashboard, click Apply changes.
Page and Tab Overview
Internal Combustion Engine Vehicles (ICEV)
The Internal Combustion Engine Vehicles page has 3 sub tabs; Fuel Cost, Tailpipe Emissions and Fuel Usage.
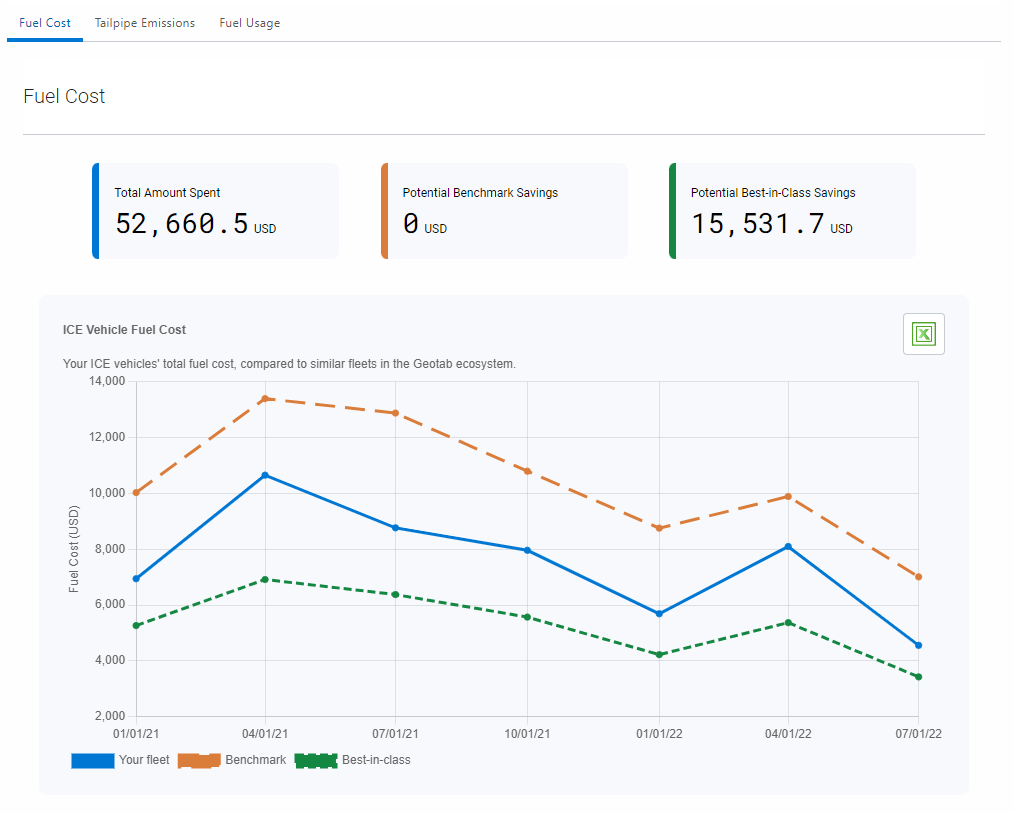
Fuel Cost
The Fuel Cost tab displays the cost of fueling your internal combustion engine vehicles as a total or as an efficiency. Your fleet’s fuel costs are compared to a Benchmark and Best-in-class of fleets similar to yours in the Geotab Ecosystem, in the top display boxes and in the time series graph.
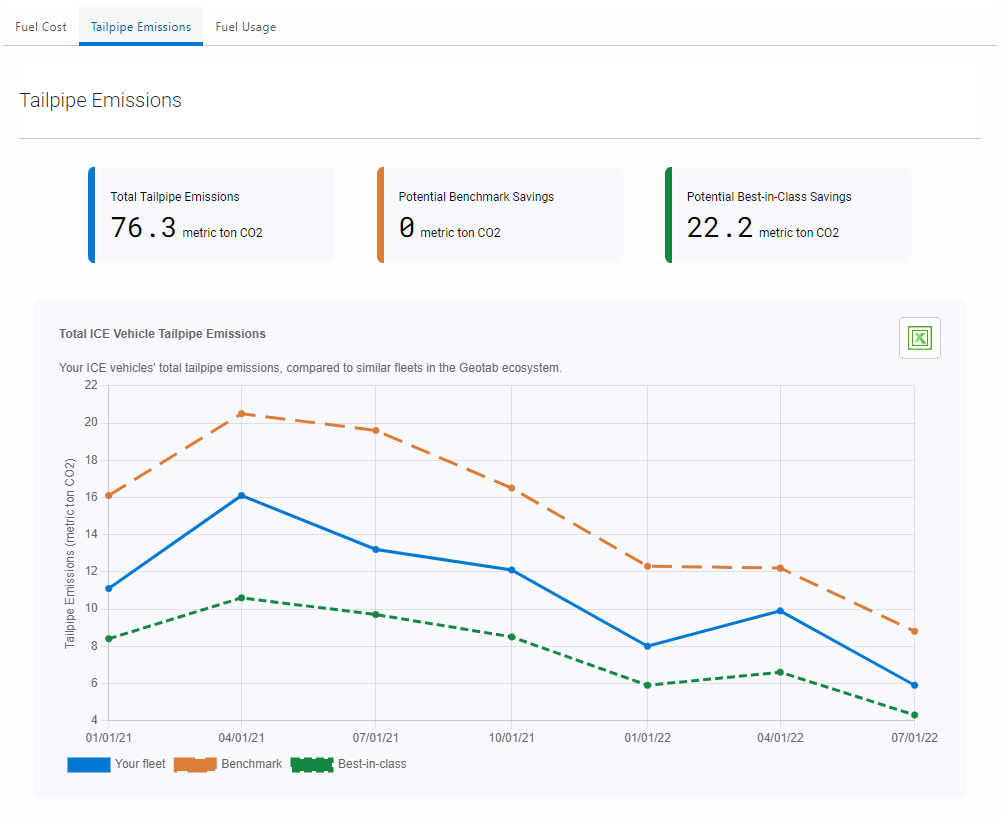
Tailpipe Emissions
The Tailpipe Emissions tab displays the CO2 emissions from fuel burnt by your internal combustion engine vehicles as a total or as an efficiency. Your fleet’s CO2 emissions are compared to a Benchmark and Best-in-class of fleets similar to yours in the Geotab Ecosystem, in the top display boxes and in the time series graph.
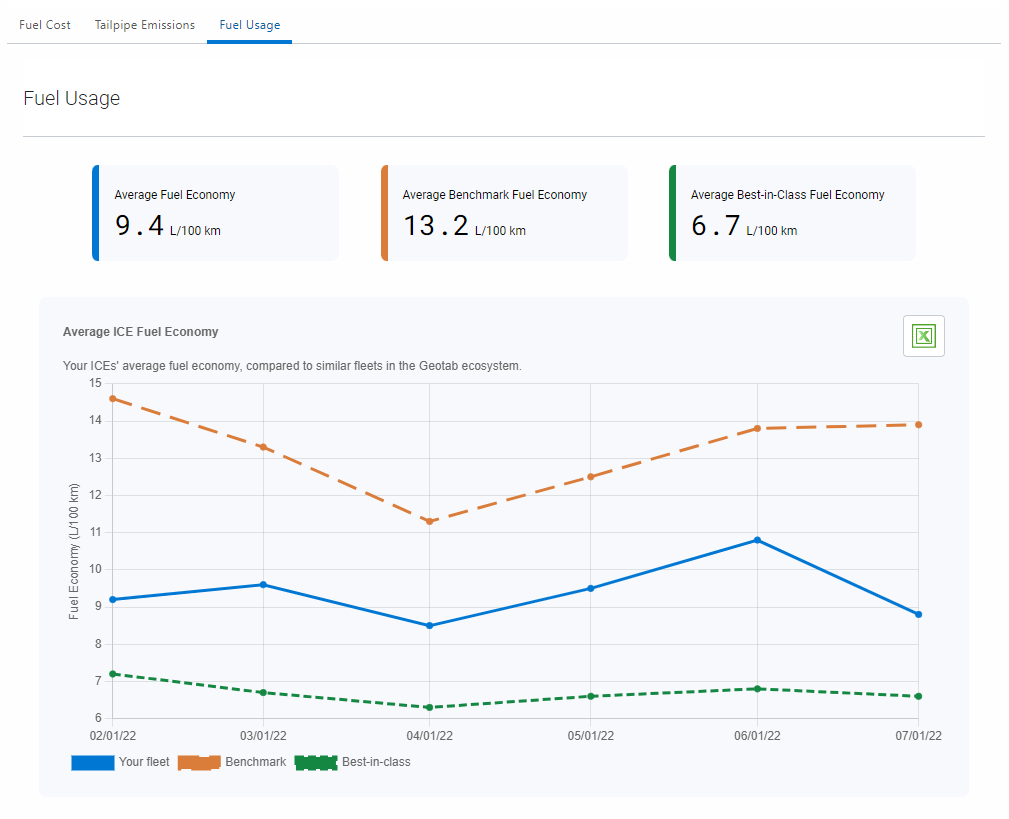
Fuel Usage
The Fuel Usage tab displays the fuel burnt by your internal combustion engine vehicles as a total or as an efficiency. Your fleet’s fuel usage is compared to a Benchmark and Best-in-class of fleets similar to yours in the Geotab Ecosystem, in the top display boxes and in the time series graph.
Recommendations
This page also provides recommendations to decrease fuel consumption, which is further broken down in the Driver Behavior tab.
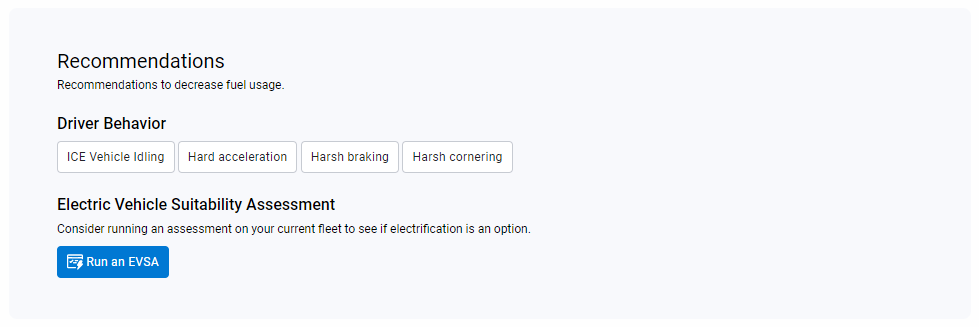
Electric Vehicles
The Electric Vehicles page can help track and improve your EV efficiency and utilization. It has 2 sub tabs; Battery Electric Vehicles (BEV) and Plug-In Hybrid Electric Vehicles (PHEV).

Tab Breakdown
Each tab displays a summary of your cost and emission savings;
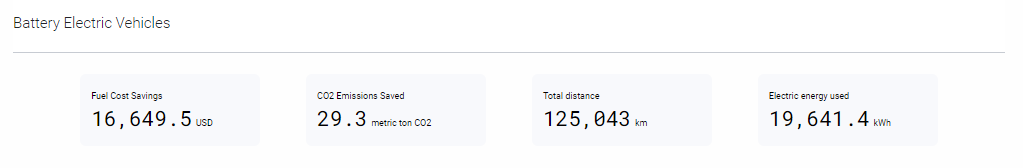
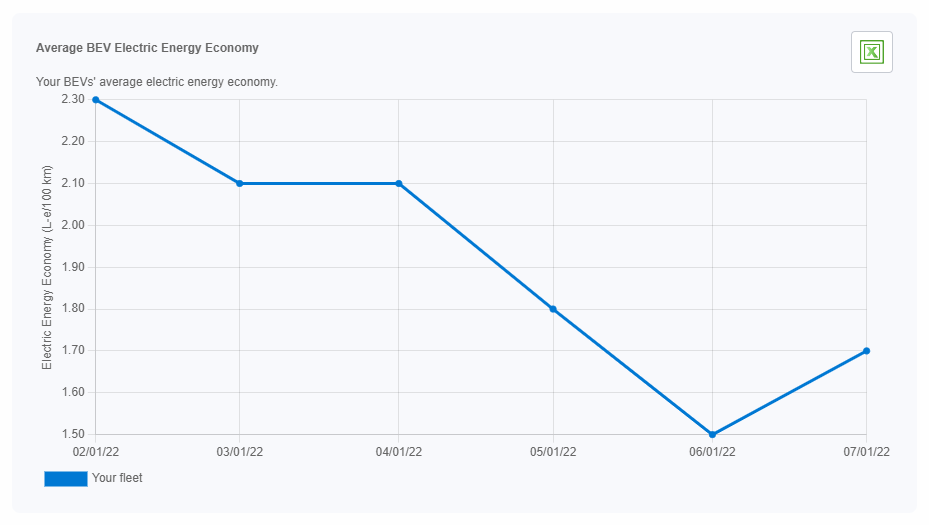
your electric energy (and Fuel for PHEV) usage;
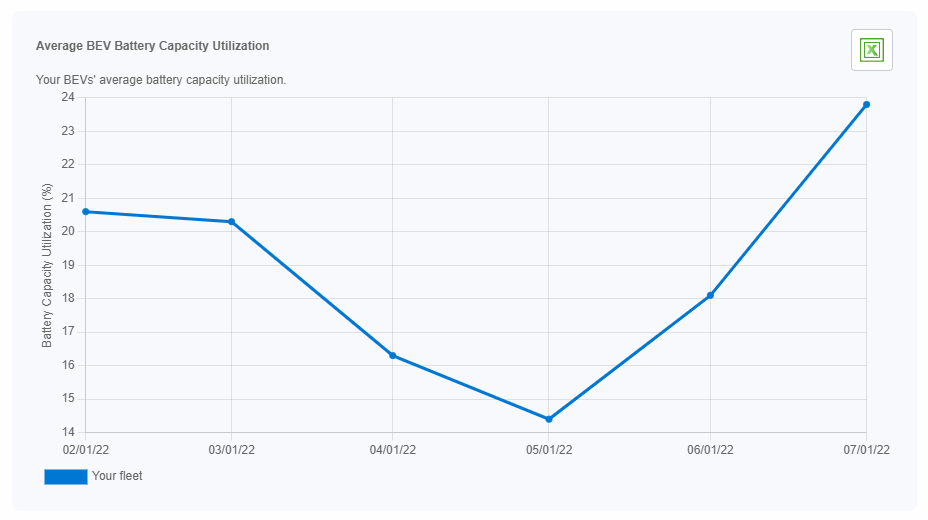
your battery capacity utilization;
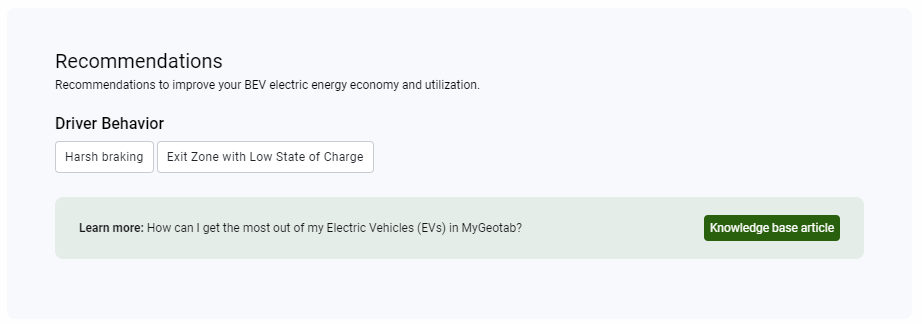
and recommendations to decrease energy (and Fuel for PHEV) consumption, and increase your utilization, which is further broken down in the Driver Behavior tab;
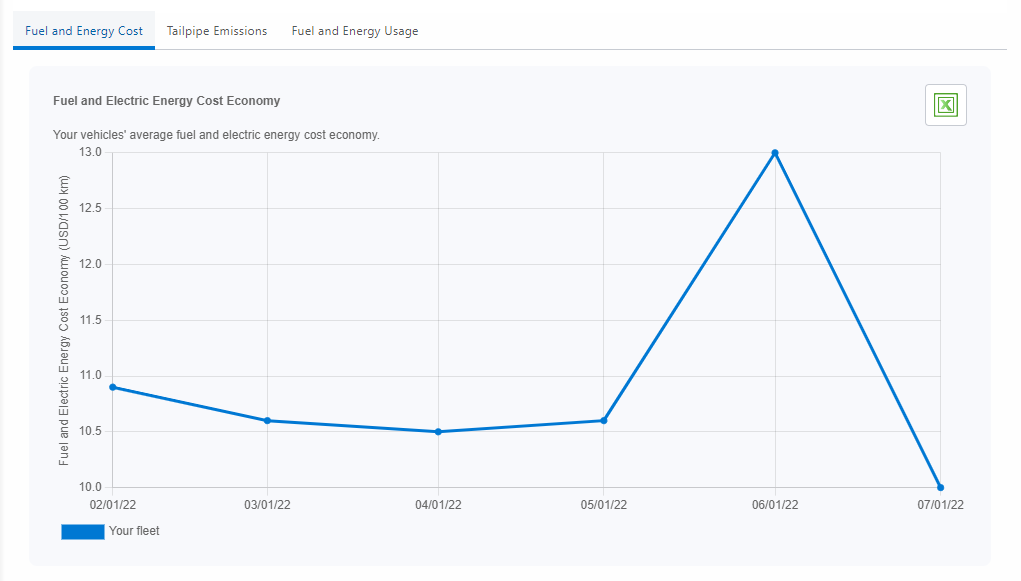
Full Fleet
The Full Fleet page displays charts that summarize holistic fleet performance. It has 3 tabs; Fuel and Energy Cost, Tailpipe Emissions and Fuel and Energy Usage.
Driver Behavior
The Driver Behavior page displays stats and graphs for key performance indicators that may impact your fleet’s cost and emissions. It has 5 tabs; ICE Vehicle Idling, Hard acceleration, Harsh braking, Harsh cornering and EV Rules.
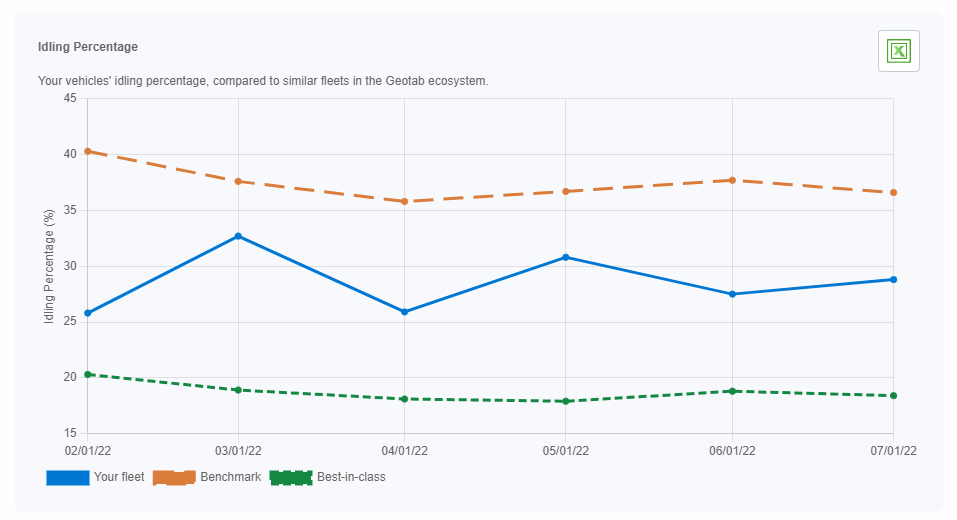
ICE Vehicle Idling
The ICE Vehicle Idling tab displays your fleet's idling fuel cost, emissions and usage as compared to Benchmarks and Best-in-Class of similar fleets to yours in the Geotab ecosystem, as well as a link to methods to decrease your fleet idling.
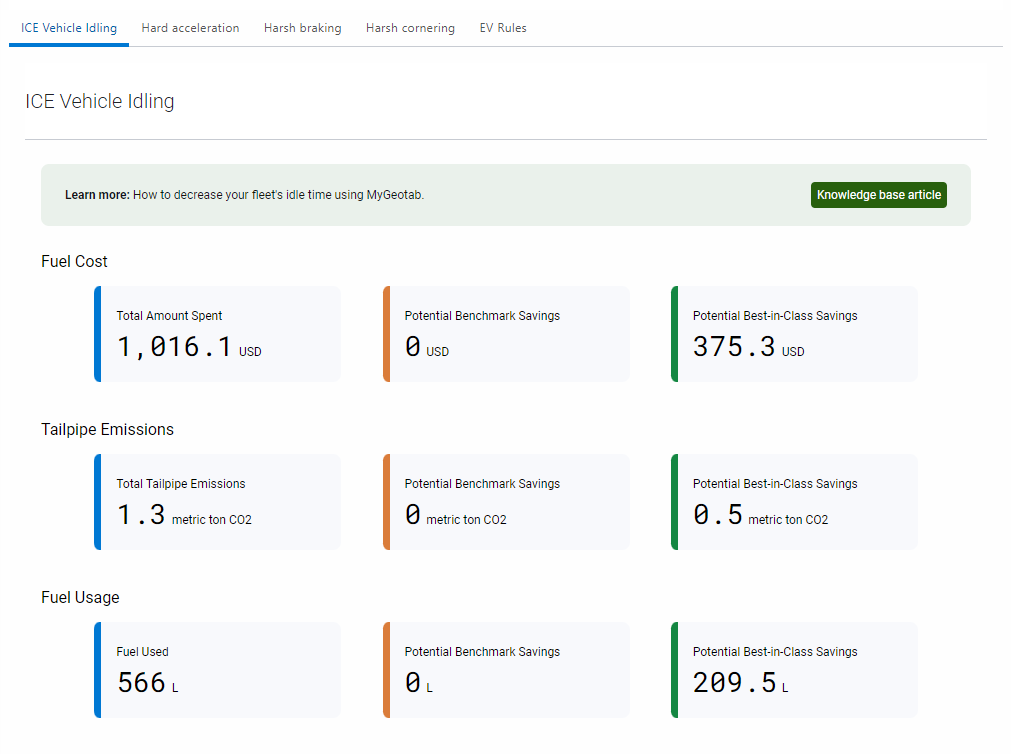
The tab also displays your fleet's idling time or percentage on a time series graph.
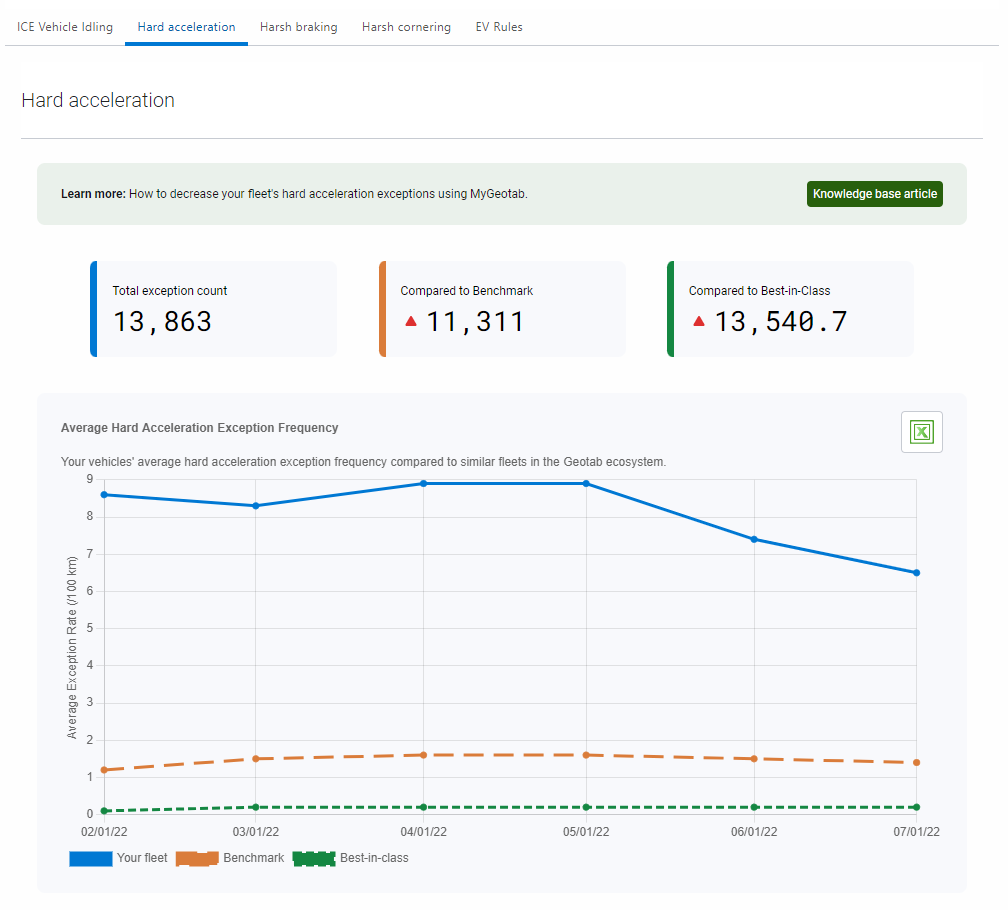
Driving Exceptions
The Hard acceleration, Harsh braking and Harsh cornering tabs display the count and rate of each event compared to similar fleets in the Geotab ecosystem, as well as a link to methods to decrease your fleet's harsh driving.
EV Rules
EV Exits Charging Zone with Low Charge
This exception is based on the zones and low charging exception thresholds set for the fleet in MyGeotab. This chart always displays an exception count.
Frequently Asked Questions
What questions does the Green Fleet Dashboard help answer?
- Is my average fleet fuel economy improving over time?
- What is my estimated cost for fueling?
- What is my carbon footprint?
- How much are my vehicles idling?
- What driving behaviors do my drivers need to work on?
- How do I compare with the fleet industry at large?
Who is the Green Fleet Dashboard for?
The dashboard is for fleet managers who want to track progress on their fuel and environmental footprint. It can be used to monitor success of green initiatives such as anti-idling policies, and to compare with overall industry trends.
Which MyGeotab users are allowed to access the Green Fleet Dashboard?
The dashboard displays data for the entire fleet. To respect data access restrictions, Geotab requires Green Fleet Dashboard users to be part of the 'Company' group and to have 'Administration', 'Supervisor', or 'View only' level security clearance. To confirm these details for a given user, visit the 'Users' page in MyGeotab and search for the user in question. If the user is part of the 'Company Group', it will indicate 'Company Group' underneath the user's name. Click on the user's name to check the associated security clearance.
How does the Green Fleet Dashboard calculate CO2 emissions?
CO2 emissions are calculated based on fuel usage and applies factors based on the IPCC Guidelines for National Greenhouse Gas Inventories.
Why is the Green Fleet Dashboard taking so long to load?
One of Geotab’s main focuses for Green Fleet Dashboard was to decrease load and run times. Please contact Geotab support if the dashboard is taking too long to load.
Why does my fleet data shown in the Green Fleet Dashboard differ from standard MyGeotab reports?
The Green Fleet Dashboard leverages custom data processing, which we continue to iterate and improve upon. The following data points may differ from elsewhere in MyGeotab:
- Fuel: The Green Fleet Dashboard estimates fuel usage for vehicles that are not providing, or are providing incorrect, fuel readings. This may result in differences between fuel usage values provided in the Green Fleet Dashboard, compared to MyG’s Fuel and EV Energy Usage Report.
- Idling: Idling data displayed on the Green Fleet Dashboard is considered true idling (i.e., anytime the vehicle is stopped and the ignition is on). This differs from the MyGeotab idling definition.
- Harsh driving exceptions: In order to compare fleets in the Geotab ecosystem, we had to set one-size-fits-all thresholds based on MyGeotab default rules, which will differ from the Exceptions generated from your custom Rules in MyGeotab.
Important note for fleets relying on data from OEM connections: Please note that OEM data uses different signal pathways that are not currently compatible with all of Geotab's data products, including the Green Fleet Dashboard. As a result, data from vehicles with OEM connections may not be included.
How are vehicles separated into vehicle types?
Geotab leverages the vehicle VIN (Vehicle Identification Number) to get vehicle type and vehicle class. If we are unable to decode the VIN, we place the vehicle into the Other vehicles category.
How is the benchmark and best-in-class determined? Who are similar fleets?
The Green Fleet Dashboard allows fleets to compare fuel and emissions metrics to a benchmarking of similar fleets in the Geotab ecosystem over time. Benchmarks are determined based on vehicle class and vocation and are weighted based on your fleets’ usage distribution (i.e., daily fleet distance per vehicle type). Benchmark is the 50th percentile, best-in-class is the 90th percentile. The benchmarking logic does not currently factor in regional conditions such as temperature. For more information on Geotab's vocation scheme, please check out this blog post.
Why does the time frame only go back to 2021-01-01?
The current version can only display data from 2021-01-01. Data will continue to fill and we will be able to display even longer time ranges in the future.
What is battery capacity utilization?
Battery capacity utilization is the percentage of battery kWh used. For example, using 75 kWh on a 50 kWh BEV (assuming a charge occurred) would equal 150% utilization.
Why is there no benchmarking for BEVs and PHEVs?
We do not have enough EVs yet. We will work to add benchmarking for EVs in the future.
Why are no benchmarks displayed in the Full Fleet page?
Currently, we only have benchmarking ability for ICEVs, so we cannot display benchmarks for metrics that involve EV vehicles.
Why are the last two days of data missing?
The Green Fleet Dashboard does not display the last two days of data.
What is “our source” for fuel and energy cost?
We use a third party data source for estimates of regional and historic fuel and electric energy.
Will the Green Fleet Dashboard be automatically updated to the latest version?
The Green Fleet Dashboard is a marketplace add-in and will automatically update to the latest version once available upon loading your database. No reinstallation is necessary for the update to occur.
Why is my fuel cost 0 when I have fuel usage?
Our source for fuel cost does not have data for the following countries: Guinea; Brunei Darussalam; Morocco (includes Western Sahara); Gambia; Swaziland; Argentina; Antigua and Barbuda; Trinidad and Tobago; Senegal; Nigeria; Commonwealth of Dominica; Paraguay; Papua New Guinea; Guernsey; Congo, Democratic Republic; St. Vincent; Albania; Saint Kitts and Nevis, Botswana; Gabon.
Support
We have set up a temporary email address: greenfleet@geotab.com. This can be used in the near future to ask questions and provide feedback directly to the Green Fleet Dashboard designers!
Otherwise:
Please reach out to your Geotab support. Contact information can be retrieved by navigating to Getting Started & Help > Support… > Contact from the MyGeotab main menu.